APPENDIX: Illustrative Examples
PROBLEM SOLVING
Most visitors to the program thought that the heart of our project was group learning But the real core was the problem sets which drove the group interaction. One of the greatest challenges that we faced and still face today was figuring out suitable mathematical tasks for students that not only would help them to crystallize their emerging understanding , but that also would show them the beauty of the subject. (Treisman, 1992, p. 368)
Problems provide opportunities for students to learn and do mathematics. The mathematical tasks faculty present to students shape what and how they learn and are critical in assessment of their learning. Within a traditional instructional sequence, problems are typically given to students after they have learned some piece of mathematics as a way to apply what they have learned. However, problems can also be used as a catalyst for learning. They can be the driving force leading to student discovery and invention. In a course driven by problems, "mathematics is what you have left over after you have invented ways to solve a problem and reflected on those inventions" (A. Selden and J. Selden, 1994, p. 5, paraphrasing Robert B. Davis).
This appendix presents a variety of examples of problems aimed at capturing the spirit and vision of the standards in this document. The problems are arranged in order of increasing difficulty and complexity. Most offer story lines. The level of realism varies, with some problems using genuine data.
A variety of content strands are represented, with an emphasis on material that traditionally has not been highlighted in introductory college mathematics. Brief remarks address the nature and role of each problem. The solutions given or suggested often span several levels of mathematical sophistication. Hence, many of the problems could be used in a variety of courses or within a single class in which students' backgrounds vary significantly. Such problems should help the reader see how the same standards can and should apply to all mathematics taught in college below the level of calculus.
The problems assume students have access to modem technology. Calculator and computer technology is becoming increasingly ubiquitous, portable, affordable, and user-friendly. This technology gives students access to certain mathematical ideas and problems at an earlier stage in the students' development than is possible without technology. Technology opens the door to exploration and experimentation because many examples can be investigated in a brief span of time. Learning mathematics empirically by discovery, with carefully sequenced tasks and the guidance of knowledgeable faculty, is a much more viable instructional option with technology than without.
The problems can accommodate a variety of teaching and learning styles. However, it is generally assumed that the mathematics classroom is a place where students are "engaged in collaborative, mathematical practice-sometimes working with others in overt ways, and always working collaboratively with peers and with the teacher in a sense of shared community and shared norms for the practice of mathematical thinking and reasoning " (Silver, 1994, p. 316).
Many of the problems can best be solved by students working in small groups. Some may be used as classroom or homework exercises. The more extensive problems may be used as laboratory projects. To get students to organize their thoughts and express them in writing, individual or group reports can be required. Students will generally write better reports if they are given detailed directions. Here is a sample set of directions for a group laboratory report:
All of the work on this lab should be done collaboratively. You will be asked to grade your own effort as well as the efforts of the other members of your group. Within the lab report clearly indicate the primary author for each section. Authorship should be shared fairly among the group members. Each lab report should have three parts: (a) Begin with a paragraph of introduction giving an overview of the nature and purposes of the lab in your own words. (b) The introduction should be followed by a write-up of each activity-what you did, how you did it, and what conclusions you reached. Include tables and graphs as appropriate. Show your work and indicate your thought processes in an organized fashion. (c) Each report should end with a paragraph of summary, conclusions, and reflections.
PRODUCING, GATHERING, AND USING GENUINE DATA
Problem solving can be made more meaningful to students if they are given opportunities to produce, gather, and use data. Gathering and producing data and all of the related issues form an important area of statistics. One need not go into all of these issues in detail, however, to use such data throughout introductory college mathematics. It is best to use genuine data, that is, real data from real sources. These can be gathered by students through computer and calculator gathering devices, library research, and surveys.
Modem technology makes obtaining real-time data much easier. This can be done by linking probes to computers or graphing calculators via special data collection devices that are readily available. Probes, or sensors, can measure temperature, light intensity, voltage, motion, sound, acidity, and other variables of scientific interest. These data can be instantly transferred into the memory of a computer or graphing calculator and used in data analysis and modeling.
Library research and surveys are also excellent ways to obtain real data. Newspapers, magazines, and simple 15- to 20- item class surveys that include such variables as height, shoe size, and gender offer a rich source of authentic data for statistical analysis. Surveys can build a sense of class unity and identity. They also offer faculty the opportunity to introduce students to the ideas of random samples and bias in data.
THE EXAMPLES
1. Chicken Chunks (Organizing Data and Pattern Recognition)
The following problem can be solved by generating and organizing relevant data and looking for patterns. The problem is challenging but does not require sophisticated mathematics.
Problem. In an effort to keep up with the expanded menu of competitors, Hal's Hamburger Haven now sells "chicken chunks" in boxes of 6, 9, and 20. Notice that some amounts of chunks cannot be purchased; for example, you cannot buy 8 or 14 chunks. Why? What is the greatest number of chunks that you cannot buy at Hal's?
2. Midpoint on a Number Une (Formula Development)
The following problem should be given in advance of the midpoint formula so that students can invent the formula. It becomes less abstract, contextually richer, and more accessible if students work in small groups using a physical number line (e.g., a meter stick or a yard stick) in the solution process. Freudenthal (1991, pp. 36-37) discusses typical student behaviors, ways to guide students' reinvention of the formula, and possible extensions for this problem type.
Problem. Locate each of the following midpoints:
- Locate the midpoint between 18 cm and 76 cm on a meter stick. Describe the mathematics used to help calculate the midpoint.
- Locate the midpoint between 15 cm and 18 cm on a meter stick. Describe the mathematics used to help calculate the midpoint.
- Locate the midpoint between 5 1/2 in. and 24 3/4 in. on a yard stick. Describe the mathematics used to help calculate the midpoint.
- Locate the midpoint between the numbers x and y. Describe the procedure used to determine the midpoint expression.
Extension. This problem can be extended to having students develop an algebraic expression for a point that is any fractional distance from x to y.
3. Tennis Ball Can (Measurement and Geometry Formula)
"Clearly" the height of a can of three tennis balls is greater than the circumference of the can. Or is that really the case? The following problem can be used to compare results obtained by measurement to results obtained by using a geometric formula Groups of students should begiven a common tennis ball can along with two paper tapes, one calibrated in inches (to eighths or sixteenths) and the other in centimeters (to tenths).
Problem. Which is greater, the height of the cylindrical tennis ball can or its circumference? By how much?
- Estimate the answer by simple observation.
- Measure the height and the diameter of the can. Determine the circumference using a geometric formula. Compare the height to the circumference.
- Measure the circumference of the can with a paper tape measure. How does the measurement compare with the results obtained from the geometric formula? Compare the height to the circumference.
Notice that the problem does not indicate which paper tape to use for the measurements and the level of precision needed in the answers. At the conclusion of the exercise, faculty should lead students to discuss the merits of the U.S. Customary System and the metric system. Furthermore, faculty may also use the example to discuss rounding and the potential errors in the answers. The ideas of precision, accuracy, and rules for operations with numbers that are the results of measurements play a key role in the education of science and technical majors.
4. Proportional Relationships
Students should know how to use the idea of proportions as a basic problem solving strategy.
Problem. Decide if a proportional relationship is present in each of the following situations. If so, describe the relationship and use it to solve the problem.
- In one small office within a corporation, 6 out of 9 management positions are held by women. If that rate holds throughout the corporation, how many of the 180 management positions are held by women?
- One inch is the same length as 2.54 cm. About how many inches is 75 cm?
- If the length of a side of a triangle is 3 in. and its area is 9 sq. in., what is the length of the corresponding side of a similar triangle whose area is 36 sq. in.?
- The scale on a roadmap is 1 inch = 20 miles. How many miles are there between two cities 11.5 inches apart on a map
5. Projecting Weekly Wages (Linear Models)
At the introductory stages of modeling, students should be expected to examine the mathematics behind a proposed model. For example, if they have reason to believe there are equal increases in y for equal increases in x, they should try a linear model. If they reason that increases are in a geometric progression, they should try an exponential model. This problem involves the development of a linear model at a basic level of mathematical sophistication and introduces students to the idea of curve fitting.
Problem. Shonda is interested in a job as a server at the Restaurante Ricardo to earn money while in college. She was told that servers are paid $12 per day for working the dinner shift on weekends plus tips. She was advised that servers averaged $4.50 per table served. Below is Shonda's analysis of her projected weekend (three-day) wages before taxes:

- Extend Shonda's analysis by making the table show her wages when 7, 13, 35, and 40 tables are served.
- Make a graphical presentation of the extended table from part a.
- Are the wages increasing at a constant rate? (That is, are the data linear?)
- Determine an algebraic model that expresses Shonda's projected wages as a function of the number of tables that she serves one weekend.
- Graph the function on the same set of axes used in part b.
- Estimate from the graph in part e Shonda's projected wages for a weekend that she serves 40 tables. Now determine the answer algebraically.
- How many tables must Shonda serve in order to project weekend wages of $200?
- Do you think that it is possible for Shonda to earn $700 in one weekend? Carefully explain.
Notice that this problem involves using different scales on each axis. The scale on the vertical axis involves relatively large numbers. The writing assignment in part h gives students the opportunity to consider the range of function values for which the function has meaning.
6. A Puzzling Problem (Geometry and Deductive Proof)
While this document calls for the use of problems that are real-world applications, all problems do not have to be of that type. Problems that are easy to state, easy for students to understand, and that have an unusual twist can pique student interest. The following problem has a nonintuitive answer. Note that the proof that is requested is needed to validate conjectures that are made. In this sense it is an integral part of the solution process, and thus, enhances the mathematics involved.
Problem. The figure below shows two congruent overlapping 10 cm by 10cm squares. The tilted square is movable, but one vertex always remains at the center of the other square that does not move.
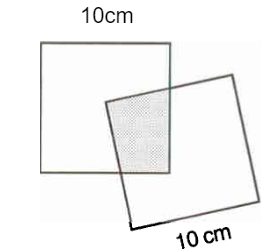
- What is the largest possible area of the overlapping shaded region?
- Validate your answer to part a by proving that your answer is correct.
Extension. In parts a and b the students should conjecture and then prove that the area of the shaded region remains a constant 25 cm2. Does the perimeter of the shaded region also remain constant? If so, find the constant perimeter. If not, determine the minimum and maximum perimeters.
Using Manipulatives. Colored, transparent 10 cm by 10 cm plastic squares are commercially available. If students can experiment with, say, a red and a blue square, they are likely to gain insight into the problem.
Using Technology. The squares in this problem can be "constructed" using a computer and commercially available interactive dynamic geometry software. Once constructed, the overlapping polygonal region can be specified and its area and perimeter can be measured. The software will give a quasi-continuous readout of these two measurements as one square is rotated about the center of the other square. This will enable the students to support previously mad conjectures which would then be verified using traditional methods. The software can also be used to draw auxiliary line segments to aid in the construction of a proof.
7. Population Growth Comparison (Exponential Growth)
Students should have the opportunity to solve problems that lend themselves to the use of multiple strategies.
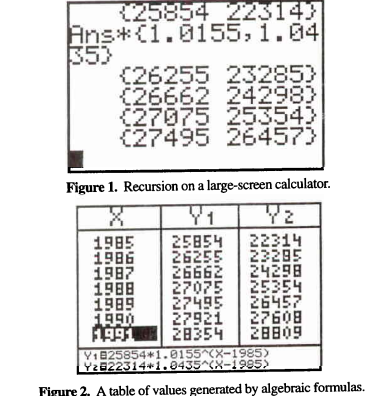
Problem. The population of Huntsville, Texas, was 25,854 in 1985 and is increasing by 1.55% each year. The population of Conroe, Texas, was 22,314 in 1985 and is increasing by 4.35% each year.
- Make a table showing the changing population of the two cities.
- In which year did or will Conroe's population first exceed Huntsville's?
Note: According to their respective Chambers of Commerce, the population of Huntsville was 23,936 in 1980 and 27:»,5 in 1990 and the population of Conroe was 18,034 in 1980 and 27,610in 1990. This implies average annual growth rates of 1.55% and 4.35%, respectively, which can be used for forward or backward population projections from the given years. 'The 1985 populations in the stated problem are the geometric means of the census figures. This problem can be readily adapted to your locality.
The problem can be solved using (1) arithmetic, by building a table one line at a time; (2) recursion, on a calculator (see Figure l); (3) a sequence defined by a recursive formula; (4) a sequence with an explicit nonrecursive formula; and by functions (5) numerically using tables (see Figure 2), (6) graphically using the ZOOM-IN feature of a graphing utility, (7) using the SOLVE feature of a calculator or computer software, or (8) the traditional way using logarithms.
8. Problem Posing
It is a good idea to let students create their own problems from a given context once they have had some experience in problem solving. This gives students a great deal of insight into the problem-solving process. It is empowering for students to realize they can create problems. Theirs will be tougher than common textbook problems m many cases. When given the following problem situation, students often generate problems involving inequalities or questions about domain and range of functions.
Problem situation. Janet is making a rectangular end table for her living room. She has decided the tabletop should have a surface area of 625 sq. in.
Task. Write three different types of questions that could be asked about this problem situation. Solve two of them. Some students responses:
- What perimeters are possible?
- What would the perimeter be if Janet makes it a square?
- The distance between the end of the sofa and the wall where the end table will go is only 18 in. How long could the end table be?
- If the table is at least 20 in. wide, how long could it be?
- What range of dimensions (length and width) are reasonable?
- What are the dimensions if the table is twice as long as it is wide?
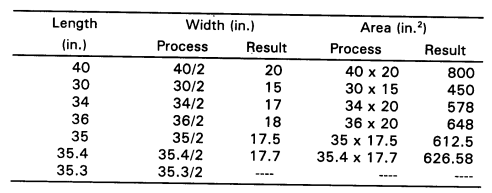
Table 1 suggests an ongoing solution strategy for the last question that requires no algebra. Problem posing can be done early in an introductory college mathematics curriculum; it is not an activity appropriate for only the precalculus level. The method of successive approximations, or systematic guess-and-check, used in Table 1 is one that can be used by students at any level. Note the "Process" columns. They are valuable because, as is often the case, the arithmetic process can give insight into the algebraic structure. The "Process" columns can be used as an instructional bridge to algebra.
Table 1. Areas for tables of various dimensions, if the table is twice as long as it is wide
9. Maintaining Pool Chlorine Level (Numerical Experimentation)
This problem presents students with a genuine problem situation for which they must make and test conjectures about its solution. With the support of technology, students can experiment to determine a solution to the problem.
Problem. Chlorine is used to control microorganisms in the water of a pool. Too much chlorine produces burning eyes; too little, and slime develops. Here are some facts about pool care:
- Chlorine dissipates in reaction to bacteria and to the sun at a rate of about 15% of the amount present per day.
- The optimal concentration of chlorine in a pool is from 1 to 2 parts per million (ppm), although it is safe to swim when the concentration is as high as 3 ppm.
- It is normal practice to add small amounts of chlorine every day to maintain a concentration within the 1 to 2 ppm ideal.
- Use a calculator to find the amount of chlorine (in ppm) remaining each day for 10 days, if the level at time zero is 3 ppm and no more is added.
- Graph the concentration of chlorine (in ppm), c, as a function of time, t, for the data determined in part a. Find the interval of time over which the chlorine level is optimal for humans.
- If chlorine is added every day, another model is necessary. Use a computer or calculator spreadsheet to model this system for a 21-day period when the concentration is 3 ppm at time zero.
-
- Try adding 1 ppm each day. Clearly that is too much, but does the pool water tum to chlorine? What is the largest amount of chlorine attainable?
- Try adding 0.1 ppm everyday. Does this process yield ideal conditions in the long run?
- Find a daily dosage that stabilizes the concentration of chlorine at 1.5 ppm.
In solving this problem, students must understand thoroughly the parameters of the situation-the facts about pool care. Through experimentation afforded by technology, students can design and determine an effective solution to the chlorine problem and judge whether their solution is reasonable.
10. Basketball Performance Factors (Matrix Operations)
Students should be able to use matrices to help them solve a wide variety of mathematics problems. The following elementary problem may be used to introduce students to the use of matrices to organize data and to the use of matrix operations for solving problems.
Problem. The women's basketball team at the University of Connecticut completed a perfect 35-0 season by defeating the University of Tennessee to win the 1995 NCAA women's basketball championship. Senior Rebecca Lobo led her team in scoring with 17 points. Does the fact that she contributed 17 points indicate the total worth of her contribution to the victory? Does the fact that Nykesha Sales scored only 10 points indicate that she made much less of a contribution? Obviously, other performance factors contribute to a team's effort. Positive factors include assists (a), steals (s), rebounds (r), and blocked shots (b). On the other hand, turnovers (t) and personal fouls (t) are examples of negative factors. Here is a listing of some of the nonshooting performance factors for the seven Connecticut players who participated in the championship game.
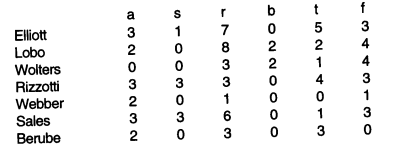
- Let each instance of a positive factor count 1 point and each instance of a negative factor count -1 point. Find each player's non-shooting performance score.
- Now think of the box score as a 7 x 6 matrix A and, similarly, the associated points as a 6 x 1 matrix B:
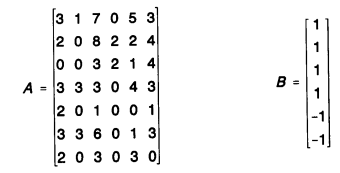
Use your calculator or computer to find the product
AB. How does the 7 x l product matrix compare with the calculations made in part a?
c. Based on your observations here, explain how matrix multiplication works. Try your ideas out by multiplying the following on your calculator and comparing it to your hand or mental calculations. Make a statement about the relative dimensions of the factor matrices and the size of the resulting product.
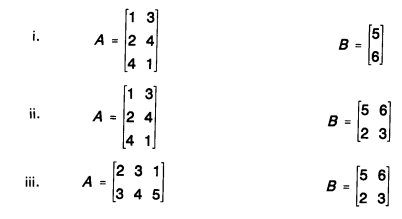
Explain any "strangeness" you observe here.
Generalizations and Extensions
d. The owner of the New York Yankees baseball team has developed a uniform incentive clause for hitters on his team. He has decided to pay them $100 for each time at bat, $400 for each run scored, $300 for each hit, and $500 for each run batted in. Find the sports section in a newspaper and calculate the value of the incentive clause for one game for the first six hitters in the Yankees' lineup. If it is not baseball season, go to the library and find the results for an old game. Set up two matrices, the 6 x 4 performance matrix and the 4 x l incentive-clause matrix, so that your calculator can do the multiplication for you.
e. In a series of games, you can calculate the value of the incentive clause for each game and then add them together. As an alternative, explain how the calculator could be used to add the performance statistics matrices of all of the games before multiplying the incentive matrix. In other words, explain how matrix addition should work.
f. Compare and contrast matrix addition with real number addition. Also, compare and contrast matrix multiplication with real number multiplication. Include a discussion of various properties such as associativity, commutativity, existence of identities and inverses, and the distributive property.
11. Dart Board Problem (Geometry and Probability)
This problem combines the ideas of area and probability in a meaningful manner.
Problem. A circular dart board has a single dot right in the middle. For each dart that hits the board 5 points are awarded. If adart lands closer to the center dot than the outer edge, an additional lO points are awarded. If a dart is thrown at random so as to hit the board, what is the probability that the extra 10 points will be awarded?
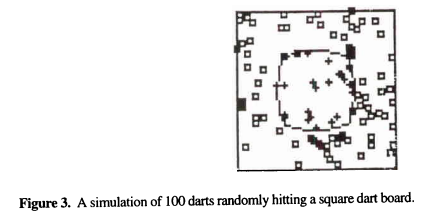
This problem can be solved using simple geometry and illustrates that doubling all linear dimensions of a plane figure quadruples its area. Alternatively, a computer or calculator program based on a random number generator can be used to simulate the dart throwing, and the relative frequencies obtained can be used to estimate the theoretical probability. This so-called "Monte Carlo" simulation can be used to illustrate the relationships between the means of several trials obtained by individuals, groups, and the entire class-leading to a discussion of weighted means and the central limit theorem.
It is not being suggested that teachers should have students write the needed computer or calculator program. Teachers could supply students with the needed program, have interested students write the program, do a classroom demonstration, or have each student find a few distances without programming and then combine the individual frequencies.
Extension. If the dart board is square, the problem becomes more challenging. Using traditional methods, it would be a fairly difficult calculus problem, but it can be solved by the Monte Carlo method with no use of calculus (see Figure 3).
12. Analyzing Planet Data (Modeling and Re-expression of Data)
A model developed for genuine data should be tested for both goodness of fit and a lack of pattern in the residuals. Mathematical models are seldom exact, and the imperfections are of serious concern. The residuals-the differences between actual and predicted values-measure the imperfections of a model. A good model should have residuals that are relatively small and randomly distributed. A correlation coefficient close to ± 1 indicates errors that are small in size but gives no indication of the nature of the distribution of residuals as the following example indicates.
The following problem leads to Kepler's third law, which states that the square of the period of orbit for each planet is equal to the cube of its semimajor axis, provided the earth's period and semimajor axis are used as the units of time and distance. It links data analysis and algebra and involves students in an interesting use of logarithms. This problem works well as an activity for groups of three or four students using cooperative learning. The solution presented below assumes this arrangement.
Problem. Consider the planet data given in Table 2. According to Kepler's first law, the orbit of each planet is an ellipse with the sun at one focus. Let T be the orbit period (i.e., the time required for one full revolution around the sun), and let a be thelength of the orbit's semimajor axis.
- Plot T versus a. Determine an algebraic model that is appropriate for the data, and justify your choice of model. Be sure to consider residuals in your justification.
- Plot log T versus log a. Determine and justify a model for this new plot.
- Compare the numerical, graphical, and algebraic aspects of your two models. How are the models related? Why?
- Revise your model in part A using the earth's period and semimajor axis as the units of time and distance. State the resulting model in words.
- Predict Pluto's orbit period given that its semimajor axis is 5.9 billion km.
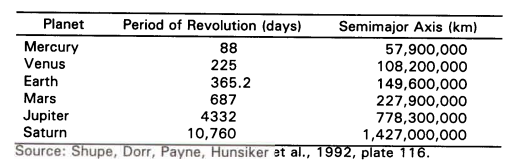
Part A. Because each x coordinate represents a semimajor axis, the points corresponding to the four inner planets are closely clustered, just as the planets themselves are closely clustered in the solar system. The scatterplot suggests that the relationship is nonlinear. Nevertheless, many groups of students will be tempted by the correlation coefficient of r = 0.9924 to conclude the relationship is linear. The least squares line, however, predicts Mercury to have a period of revolution of -363 days and yields a residual plot with a clearly nonrandom pattern.
Students will likely try several other options before deciding that a power function provides the best model, if they reach that conclusion at all. The example shows that mathematical and scientific considerations are essential parts of the modeling process. Students should attempt to use scientific information at the beginning of a modeling process to suggest potential models, or at the end of the process to validate models that they develop. In this case, a power function model with a power of 1.5 yields a nearly perfect correlation of 1, suggesting the data points lie very close to the graph of the power function.

A power of 1.5 is consistent with Kepler's third law. Students can overlay the graph of the regression equation model over the scatter plot to further confirm the choice of models.
Part B. Technology makes it easy for students to obtain the log-log data and its plot. Many students will be surprised at how different this plot is from the previous plot. The points are spaced more uniformly. The relationship appears to be linear. So, students will readily pick a linear regression model. It is hoped, most groups will notice how much easier it is to find this model and that logarithms greatly simplify the relationship between the variables.

Part C. Students should notice that the correlation coefficients match in the models in parts A and B, and the slope of the line in B matches the power in A. To explain these relationships, students will need to sort through the conflicting notation. The variables a, b, x, and y have all been used in multiple ways. The situation with a is the worst. It has been used as a regression coefficient in each model and also represents the semimajor axis. The algebra reveals that the two models are equivalent. It also suggests a connection between the models that most students would not have anticipated, that the logarithm of the coefficient in A is the constant term, or y intercept, in B. Students should be encouraged to support this with numerical evidence.
Part D. Students can change the periods to earth-based time units (i.e., years) by dividing the list of periods by 365.2, the number of days per year. Students need to change the distances to earth-based units, too. This can be done by dividing the list of distances by its earth entry. The earth-based distances obtained are in astronomical units. The power regression option will yield a model that is essentially T = a3/2, which is equivalent to Kepler's equation T2= a3.
Part E. This may seem anticlimactic because students merely need to substitute Pluto's semimajor axis value into the model in part A. The predictive power of scientific theory, however, should not be discounted. As an illustration, gravitational theory led Lowell to postulate the existence and general location of Pluto 25 years before it was first sighted. Library research is a natural follow-up to this planet problem. For example, students could be asked to check whether the answer found for part E is consistent with information in the literature, to verify that the data for Uranus and Neptune fit the model, or to write a report on Kepler's laws.
13. A Pure Mathematics Problem (Absolute Value Functions)
Thus far, most of the example problems have had a context, a story line. Some of the problems are obviously contrived (e.g., the dart board problem, 12), while others are based on genuine data (e.g., the planet problem, 13). Mathematics presented in context is often more attractive to students and will engage their interest and attention to a greater degree than mathematics without a context.
Lest there be any doubt, however, there are many worthwhile and important pure mathematics problems, like the one presented below. This problem presents pure mathematics in a way that allows for group interaction and use of technology to develop critical concepts.
Part A. Sketch a graph for each function. On the same axes, in a different color, dash in the graph produced by omitting the absolute value operation. Check your graphs with a graphing utility.
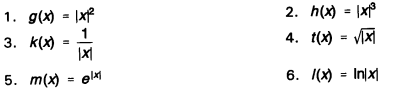 Conclusions: Describe how applying the absolute value operation before the characteristic operation affects the graph.
Part B. Sketch a graph for each function. On the same axes, in a different color, dash in the graph produced by omitting the absolute value operation. Check your graphs with a graphing utility.
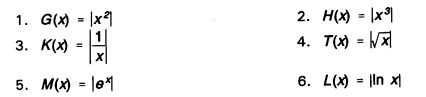 Conclusions: Describe how applying the absolute value operation after the characteristic operation affects the graph.
Part C. Sketch a graph for each function. On the same axes, in a different color, dash in the graph produced by omitting the absolute value operation.
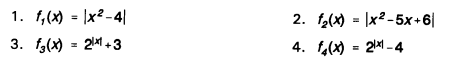 Conclusions: Do your descriptions from part A and part B explain how to produce the graphs involving absolute value from their standard graphs? Give steps to produce such a graph.
Part D. Generalize your conclusions. Use the steps you listed in part C to sketch the graph of each of the following functions. Don't use any other method. Now by checking points or using your grapher determine if the graph is correct.
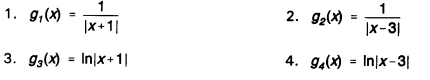 Conclusions: If your steps did not cover these cases, explain why. Redo your descriptions to cover these more general cases.
14. A Writing Assignment
These standards emphasize the role of writing in the learning of mathematics. Students can learn about how mathematics is used in their major fields of study by interviewing practitioners or doing library research and then writing reports. For example, business students might report on how finance charges are determined on credit card purchases.
In a very practical sense, technical majors will be expected to write reports for their employers. Consider the following problem:
Problem. The production plans for a factory indicate the need for 3600 Model 12 units for the upcoming year (June through May). The demand for the Model 12 is even throughout the year. Each Model 12 unit requires a prefabricated encasement that is obtained from an outside vendor. 1be vendor will allow the factory to determine the number of shipments in which the 3,600 encasements will be sent but mandates that an equal number of encasements be sent in each shipment. The charge are as follows:
- Each encasement costs $7.26 but a 6% price increase has been planned for December 1.
- A service charge of $50 is due on each shipment.
Additionally, the factory is only able to store 600 encasements at any one time. Provide the vender with a report indicating the number of shipments to make and when they should be received by the factory. Provide your employer with justification for your decision.
15. A Laboratory Project-Fluid Flow (Data Gathering and Curve Fitting)
Mathematics at the introductory level should be taught as a laboratory science. Stevens (1993) presents several examples of sources of data that lend themselves to laboratory modeling projects. They include the heights of com seedlings as a function of time, normal high temperature as a function of the day of the year, and the height of a burning candle as a function of the length of time that it has been burning. Students might also attempt to model the price of one brand of laundry detergent as a function of the weight or volume of the detergent, or develop a population model for a country like Mexico over the past 30 years.
In some situations, scientific principles or previous experiences indicate the type of model that should be developed. In other cases, students have to experiment with a variety of models to determine the one that fits best. Once the data have been gathered and graphed, students can determine the parameters of the hypothesized model algebraically, through trial and error (seeing how well the proposed model fits the points), or by using regression programs on a calculator or computer.
The following project does not need any special data gathering equipment other than a stopwatch. It is assumed that students are working in groups.
Introduction. As liquid flows through a hole at the bottom of a container with a constant cross-sectional area, the height of the liquid above the hole is a function of the time that the liquid has been flowing. The fact that the function is a quadratic function is an application of Torricelli's law.
Objective. Students will gather data and fit the data to a quadratic function using educated trial and error. They will determine approximations of the needed parameters algebraically and then refine their approximations graphically.
Procedures

- Calibrate the height of a clear plastic container that has a constant cross-sectional area in centimeters. Drill a small hole at zero. It is best to put the zero point a few centimeters up from the bottom of the container. (The whole container does not have to have a constant cross-sectional area. Simply calibrate the portion that is constant.) A height of about 10 cm is sufficient. Fill the container with colored water to the 10-cm mark while holding your finger over the hole.
- Release your finger from the hole and at the same time have a groupmate start the stopwatch. Detennine the length of time that it takes to pass the 8-cm, 6-cm, and 4-cm marks and record the results. You might want to do the experiment three times and use the mean time at each level.
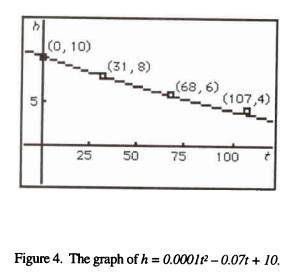
- You must now determine a quadratic function h=at2+bt+c that best fits the data. Plot your four data points [(O,10) is the first point]. Use algebra to determine a quadratic function through three of the points. Modify the parameters of that function so that it "best" fits all four of the data points. Here, the best fit is simply determined by looking at the graph.
- Once you have determined a function that closely fits all four data points, predict when the fluid will be at h = 0. Fill the container to a height of 10 cm and measure the time that it takes the water level to get to zero. How accurate was your prediction?
Conclusion. Write a report that explains the procedures that you used and provide a description of your results. Explain the reasoning that you used. Specifically explain how changing the parameters affected the shape of your graph.
Possible Model. A one gallon window washer fluid container was used to gather the following data.
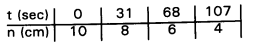
Figure 4 represents the graph of h = 0.0001t2- 0.07t + 10. Improvements can be made to the fit by changing the coefficients of t2 and t.
CLOSING REMARKS
In this appendix, problem ideas have been presented to illustrate how the standards of this document can be realized in the college mathematics classroom. It is hoped that the problems will stimulate the imagination of college mathematics faculty to develop rich and meaningful activities for their students that will help them learn mathematics and appreciate its power and utility.
There are many sources for interesting problems and curricular materials. The National Science Foundation supports projects in undergraduate mathematics course and curriculum development. Professional journals, such as The AMATYC Review, the College Mathematics Journal, the Mathematics Teacher, and PRIMUS offer many classroom ideas and interesting problems. The Consortium for Mathematics and Its Applications (COMAP) has developed numerous applications modules which are available for purchase. Professional meetings and workshops offer many valuable ideas and invaluable collegial interaction.
Professional organizations and commercial publishers have already developed some textbooks, software, and other materials in keeping with the spirit of this document. As time goes on, the number and quality of such materials will likely increase.